Hybrid D-ND Model with modular transformations, adaptive probabilities, and visualization.
The current implementation includes a modularized Python code for simulating the Hybrid Dual-Non-Dual (D-ND) model.
"The current implementation includes a modularized Python code for simulating the Hybrid Dual-Non-Dual (D-ND) model. It incorporates the following key features:\n\n1. **System Parameters**: All simulation parameters (iterations, transition thresholds, lambda_linear, etc.) are stored in the `SystemParameters` class for better manageability.\n\n2.
**Linear and Fractal Phase Functions**:\n - Implemented separate transformations for linear and fractal phases.\n - Transformations include homothetic contraction, reflection, and probabilistic transformations.\n\n3.
**Adaptive Probabilities**:\n - Probabilities (α, β, γ) are updated dynamically based on dispersion and average distance from Proto-Assioma.\n\n4.
**Visualization**:\n - Real-time interactive visualization using `ipywidgets` to display the evolution of points in the complex plane.\n - Integrated sliders for adjusting iterations, lambda, and threshold interactively.\n\n5.
**Stabilization Logic**:\n - Uses the Hausdorff distance to determine the transition from linear to fractal phases.\n\n6.
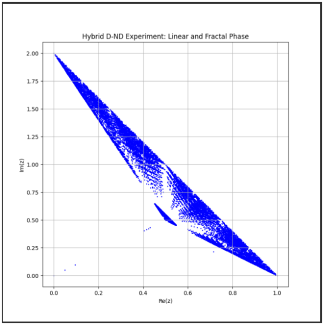
**Logging**:\n - Integrated logging for debugging and tracking updates in probabilities, transformations, and transitions.\n\nThe system is set up for future improvements, such as:\n- Adding parallelization to speed up processing.\n- Reintroducing fractal dimension calculations.\n- Enabling machine learning integration to predict stabilization behavior.\n\nThe results indicate successful transitions and provide insights into the geometric patterns generated by the model."
import random
import matplotlib.pyplot as plt
import numpy as np
from scipy.spatial.distance import directed_hausdorff
import ipywidgets as widgets
from IPython.display import display
import logging
from multiprocessing import Pool
from sklearn.linear_model import LinearRegression
import time
# Initialize logging
logging.basicConfig(level=logging.INFO, format='%(asctime)s - %(levelname)s - %(message)s')
# ==============================================================
# SYSTEM PARAMETERS CLASS
# ==============================================================
class SystemParameters:
def __init__(self, iterations=10000, transition_threshold=0.005, lambda_linear=0.1,
P=complex(0.5, 0.5), alpha=0.4, beta=0.4, gamma=0.2):
self.iterations = iterations
self.transition_threshold = transition_threshold
self.lambda_linear = lambda_linear
self.P = P
self.alpha = alpha
self.beta = beta
self.gamma = gamma
# ==============================================================
# LINEAR PHASE FUNCTIONS
# ==============================================================
def f1_linear(A, B):
"""
Combines sets A and B.
"""
return A.union(B)
def f2_linear(R_t, P, params):
"""
Moves each point z in R_t towards P by a fraction lambda_linear.
"""
return {z + params.lambda_linear * (P - z) for z in R_t}
def f3_linear(R_t, P):
"""
Reflects each point z with respect to P.
"""
return {P - z for z in R_t}
# ==============================================================
# FRACTAL PHASE FUNCTIONS
# ==============================================================
def T_A(z):
"""
Transformation A: contraction towards (0 + i).
"""
return z / 2 + 1j
def T_B(z):
"""
Transformation B: contraction towards (1 + 0j).
"""
return (z + 1) / 2
def f1_fractal(points):
"""
Applies T_A or T_B with 50/50 probability.
"""
new_set = set()
for z in points:
if random.random() < 0.5:
new_set.add(T_A(z))
else:
new_set.add(T_B(z))
return new_set
def f2_fractal(points, P, params):
"""
Homothetic contraction towards P with factor lambda_linear.
"""
return {z * (1 - params.lambda_linear) + params.lambda_linear * P for z in points}
def f3_fractal(points, P):
"""
Light translation of points towards P (fixed alpha_lin coefficient of 0.1).
"""
alpha_lin = 0.1
return {P + alpha_lin * (z - P) for z in points}
# ==============================================================
# TRANSFORMATION SELECTION FUNCTIONS
# ==============================================================
def pick_linear_transform(R_t, P, params):
"""
Randomly selects a linear transformation with probabilities α, β, and γ.
"""
x = random.random()
if x < params.alpha:
B = {complex(1, 0), complex(0, 2)} # Fixed set for f1_linear
return f1_linear(R_t, B)
elif x < params.alpha + params.beta:
return f2_linear(R_t, P, params)
else:
return f3_linear(R_t, P)
def pick_fractal_transform(R_t, P, params):
"""
Randomly selects a fractal transformation with probabilities α, β, and γ.
"""
x = random.random()
if x < params.alpha:
return f1_fractal(R_t)
elif x < params.alpha + params.beta:
return f2_fractal(R_t, P, params)
else:
return f3_fractal(R_t, P)
# ==============================================================
# ADAPTIVE PROBABILITIES
# ==============================================================
def update_probabilities(R, P):
"""
Updates the probabilities α, β, and γ based on the set dispersion.
"""
try:
if not R:
return 0.4, 0.4, 0.2 # Return default if R is empty
points_arr = np.array([(z.real, z.imag) for z in R])
if points_arr.size == 0:
return 0.4, 0.4, 0.2 # Return default if no points in the set
center = np.mean(points_arr, axis=0)
dispersion = np.std(points_arr - center)
avg_distance_p = np.mean(np.abs(points_arr - np.array([P.real, P.imag]))) # Calculate average distance from Proto-Assioma
# Example logic: Adjust probabilities based on dispersion and distance from P
alpha_new = 0.4 - 0.05 * dispersion + 0.05 * avg_distance_p
beta_new = 0.4 + 0.05 * dispersion - 0.02 * avg_distance_p
gamma_new = 0.2 - 0.03 * dispersion - 0.03 * avg_distance_p
# Ensure probabilities are within [0, 1]
alpha_new = max(0, min(1, alpha_new))
beta_new = max(0, min(1, beta_new))
gamma_new = max(0, min(1, gamma_new))
# Normalize to ensure alpha + beta + gamma = 1
total = alpha_new + beta_new + gamma_new
if total == 0:
return 0.4, 0.4, 0.2 # Return default if normalization fails
alpha_new /= total
beta_new /= total
gamma_new /= total
return alpha_new, beta_new, gamma_new
except Exception as e:
logging.error(f"Error in update_probabilities: {e}")
return 0.4, 0.4, 0.2 # Return default if error occurs
# ==============================================================
# ERROR HANDLING AND ADDITIONAL UTILITIES
# ==============================================================
def is_stable_hausdorff(R_t, R_t1, threshold):
"""
Stabilization: if max difference between corresponding points < threshold.
"""
try:
if not R_t1 or not R_t:
return False
R_t_arr = np.array([(z.real, z.imag) for z in R_t])
R_t1_arr = np.array([(z.real, z.imag) for z in R_t1])
if R_t_arr.size == 0 or R_t1_arr.size == 0:
return False
dist1 = directed_hausdorff(R_t_arr, R_t1_arr)[0]
dist2 = directed_hausdorff(R_t1_arr, R_t_arr)[0]
hausdorff_distance = max(dist1, dist2)
return hausdorff_distance < threshold
except Exception as e:
logging.error(f"Error in is_stable_hausdorff: {e}")
return False
# ==============================================================
# INTERACTIVE VISUALIZATION WITH IPYWIDGETS
# ==============================================================
def create_interactive_widgets(params):
"""Creates interactive widgets for parameter adjustment."""
iterations_slider = widgets.IntSlider(value=params.iterations, min=100, max=20000, step=100,
description='Iterations:')
lambda_slider = widgets.FloatSlider(value=params.lambda_linear, min=0.01, max=0.5, step=0.01,
description='Lambda:')
threshold_slider = widgets.FloatSlider(value=params.transition_threshold, min=0.0001, max=0.01,
step=0.0001, description="Threshold")
output_widget = widgets.Output()
display(iterations_slider, lambda_slider, threshold_slider, output_widget)
return iterations_slider, lambda_slider, threshold_slider, output_widget
# ==============================================================
# MAIN SYSTEM FUNCTIONS
# ==============================================================
def initialize_system(params):
"""Initializes the system with starting values."""
R = {complex(0, 0)}
all_points = set(R)
linear_phase = True
ml_data = []
start_time = time.time()
transition_time = None
return R, all_points, linear_phase, ml_data, start_time, transition_time
def run_linear_phase(R, all_points, params):
"""Runs the linear phase transformations."""
R_next = pick_linear_transform(R, params.P, params)
all_points.update(R_next)
params.alpha, params.beta, params.gamma = update_probabilities(R_next, params.P)
logging.info(f"Updated probabilities: alpha={params.alpha:.2f}, beta={params.beta:.2f}, gamma={params.gamma:.2f}")
return R_next, all_points
def run_fractal_phase(R, all_points, params):
"""Runs the fractal phase transformations."""
R_next = pick_fractal_transform(R, params.P, params)
all_points.update(R_next)
return R_next, all_points
def check_stabilization(R, R_next, params):
"""Checks for stabilization using the Hausdorff distance."""
if is_stable_hausdorff(R, R_next, params.transition_threshold):
logging.info("Stabilization reached.")
return True
return False
def visualize_results(all_points):
"""Visualizes the results."""
x_vals = [z.real for z in all_points]
y_vals = [z.imag for z in all_points]
plt.figure(figsize=(8, 8))
plt.scatter(x_vals, y_vals, s=1, color="blue")
plt.title("Hybrid D-ND Experiment: Linear and Fractal Phase")
plt.xlabel("Re(z)")
plt.ylabel("Im(z)")
plt.grid(True)
plt.show()
def run_simulation(params, iterations_slider, lambda_slider, threshold_slider, output_widget):
"""Runs the main simulation loop."""
R, all_points, linear_phase, ml_data, start_time, transition_time = initialize_system(params)
with output_widget:
output_widget.clear_output(wait=True)
for t in range(1, iterations_slider.value + 1):
if linear_phase:
R_next, all_points = run_linear_phase(R, all_points, params)
if check_stabilization(R, R_next, params):
transition_time = time.time() - start_time
ml_data.append([params.iterations, params.lambda_linear, params.transition_threshold, transition_time])
linear_phase = False
R = R_next
else:
R = R_next
else:
R_next, all_points = run_fractal_phase(R, all_points, params)
R = R_next
visualize_results(all_points)
# ==============================================================
# MAIN EXECUTION LOGIC
# ==============================================================
params = SystemParameters()
iterations_slider, lambda_slider, threshold_slider, output_widget = create_interactive_widgets(params)
# Attach callbacks
def on_slider_change(change):
run_simulation(params, iterations_slider, lambda_slider, threshold_slider, output_widget)
iterations_slider.observe(on_slider_change, names='value')
lambda_slider.observe(on_slider_change, names='value')
threshold_slider.observe(on_slider_change, names='value')
# Run initial plot
run_simulation(params, iterations_slider, lambda_slider, threshold_slider, output_widget)